
Understanding Standard Deviation in Finance with Online Calculators
Standard deviation is a crucial statistical measure in finance used to quantify the dispersion of a dataset around its mean. In simpler terms, it tells you how spread out a set of numbers is. In the context of investing, standard deviation helps assess the volatility or risk associated with an investment.
A higher standard deviation indicates greater volatility, meaning the returns on an investment are likely to fluctuate significantly. Conversely, a lower standard deviation suggests less volatility and more predictable returns. Investors use this information to gauge the potential upside and downside risks of different investment options.
Why Use a Standard Deviation Finance Calculator?
Calculating standard deviation manually can be tedious and prone to errors, especially with large datasets. A standard deviation finance calculator simplifies this process, offering several benefits:
- Accuracy: Minimizes the risk of calculation errors, ensuring reliable results.
- Speed: Performs calculations quickly, saving time and effort.
- Convenience: Accessible online, allowing for on-the-go analysis.
- Data Analysis: Easily handles large datasets, providing a comprehensive overview of volatility.
How Standard Deviation is Used in Finance
Standard deviation has many practical applications in finance:
- Risk Assessment: Helps investors understand the level of risk associated with a particular asset or portfolio. Higher standard deviation indicates a riskier investment.
- Portfolio Diversification: Enables investors to construct portfolios with a desired level of risk by combining assets with varying standard deviations.
- Performance Evaluation: Used to compare the risk-adjusted performance of different investments. For example, the Sharpe ratio uses standard deviation to measure excess return per unit of risk.
- Option Pricing: A key input in option pricing models like the Black-Scholes model.
- Volatility Trading: Traders use standard deviation to understand and profit from changes in market volatility.
Using a Standard Deviation Calculator Effectively
While a calculator simplifies the computation, understanding how to interpret the results is crucial. Here’s a step-by-step guide:
- Gather Data: Collect historical returns for the asset or portfolio you want to analyze. This could be daily, weekly, monthly, or annual returns.
- Input Data: Enter the data into the standard deviation finance calculator. Most calculators allow you to input data manually or upload a file.
- Calculate: Click the “Calculate” button to generate the standard deviation.
- Interpret Results: Analyze the standard deviation value. Remember that a higher value indicates greater volatility.
- Consider Context: Always consider the standard deviation in the context of the specific investment and your overall financial goals. Compare the standard deviation to benchmarks or similar investments.
In conclusion, a standard deviation finance calculator is a valuable tool for investors and financial professionals seeking to understand and manage risk. By simplifying the calculation process, it allows users to focus on interpreting the results and making informed investment decisions. However, it’s important to remember that standard deviation is just one factor to consider when evaluating investments, and it should be used in conjunction with other analytical tools and techniques.
 1000×827 standard deviation calculator finance lawscom from finance.laws.com
  1020×622 standard deviation calculator from standard-deviation-calculator.en.softonic.com
  426×383 variance standard deviation from financetrain.com
  1600×940 top real life applications standard deviation from www.standarddeviationcalculator.io
  1280×720 standard deviation stock return calculator excel ryan oconnell cfa from ryanoconnellfinance.com
  640×480 discrete random variable standard deviation calculator from www.gyanipandit.com
  1280×720 standard deviation finance calculator powerpoint google from www.slideteam.net
  770×779 grouped data standard deviation calculator from ncalculators.com
  770×538 standard deviation calculator simple method from ncalculators.com
  1920×1080 graphing calculator standard deviation shannon london blog from storage.googleapis.com
  1699×868 standard deviation from corporatefinanceinstitute.com
  1920×1080 standard deviation mutual fund myfinopediacom from www.myfinopedia.com
  960×720 standard deviation calculator lists melvin chan blog from storage.googleapis.com
  474×355 standard deviation formula calculating standard deviation from fastloans.ph
  1024×512 standard deviation formula calculation steps from www.erp-information.com
  1280×720 calculate standard deviation graphing calculator jenny mcnear blog from storage.googleapis.com
  736×491 standard deviation calculator calculate steps from www.pinterest.com
  474×237 standard deviation formula calculation from www.erp-information.com
  768×395 sample standard deviation formula calculation excel template from www.educba.com
  643×504 standard deviation formula from fity.club
  1140×1264 quiz worksheet standard deviation variance finance studycom from study.com
  875×607 standard deviation definition calculation applications from www.financestrategists.com
  1024×461 standard deviation formula step step calculation from www.wallstreetmojo.com
  1280×720 calculate standard deviation calculator roberta york blog from storage.googleapis.com
  1024×683 calculate standard deviation calculator marianne from storage.googleapis.com
  1024×461 portfolio standard deviation formula examples calculate from www.wallstreetmojo.com
 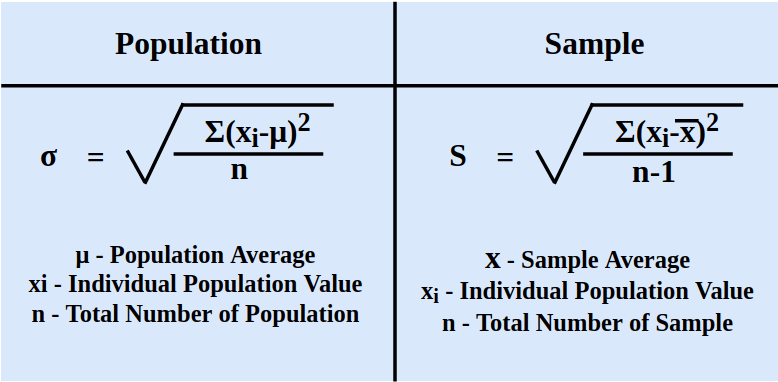 474×232 standard deviation formula examples calculate geeksforgeeks from www.geeksforgeeks.org
 :max_bytes(150000):strip_icc()/calculate-a-sample-standard-deviation-3126345-v4-CS-01-5b76f58f46e0fb0050bb4ab2.png) 1500×1000 calculate sample standard deviation from www.thoughtco.com
1500×1000 calculate sample standard deviation from www.thoughtco.com  822×434 weighted standard deviation formula stats formula lasoparx from lasoparx807.weebly.com
  720×405 calculate standard deviation guide calculator examples from www.scribbr.co.uk